The Bullwaves Prime dashboard is designed to do more than display account balances. It brings together risk metrics, trading performance, challenge objectives, and account progress in a single interface, allowing traders to monitor every stage of their evaluation without switching between multiple pages.
Bullwaves Prime Dashboard Enhances Trading Oversight
For prop traders, having immediate access to performance data can influence decision-making just as much as challenge rules themselves. Rather than relying solely on end-of-day reports, Bullwaves Prime presents live statistics that help traders understand where they stand before placing their next position.
Bullwaves Prime Dashboard Brings Core Trading Metrics Together
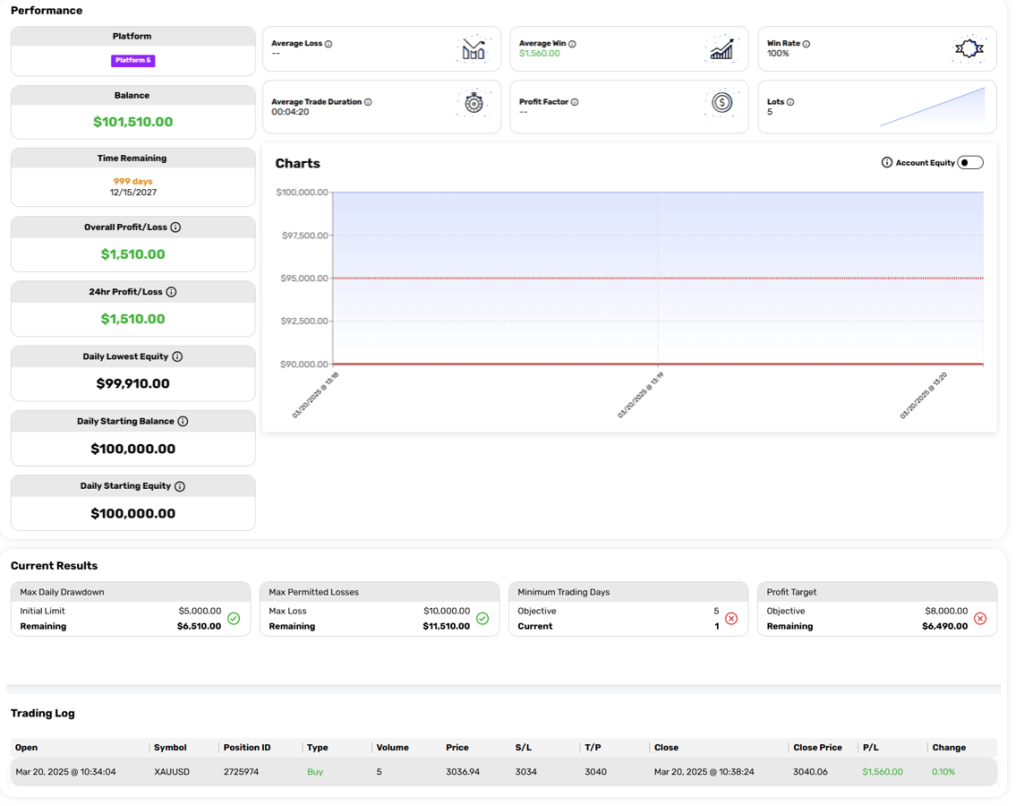
From the dashboard preview, traders can monitor a wide range of account statistics directly from the main screen.
Among the available metrics are:
- Current account balance and equity
- Overall and 24-hour profit/loss
- Average winning trade
- Win rate
- Average trade duration
- Trading volume (lots)
- Daily starting balance and equity
- Daily lowest equity
- Remaining trading time
- Interactive equity performance chart
The interface also displays challenge objectives in dedicated progress panels. These include remaining daily drawdown, maximum permitted loss, minimum trading day requirement, and progress toward the profit target.
Having these figures visible without navigating through different menus makes it easier for traders to evaluate their account status throughout the trading session.
Real-Time Progress Tracking Reduces Operational Uncertainty
One of the more practical aspects of the Bullwaves Prime dashboard is how it separates performance metrics from challenge requirements.
Many traders know their profit target but lose track of how close they are to violating daily or overall drawdown rules. Displaying these thresholds alongside live account performance reduces the need for manual calculations, particularly during periods of higher market volatility.
The trading log also records each completed position with details including entry and exit time, position size, stop loss, take profit, closing price, and realized profit. This allows traders to review execution without exporting reports immediately after every trade.
Why Dashboard Design Matters in Prop Trading
Dashboard quality is often overlooked when comparing prop firms, yet it plays a meaningful role in daily trading operations.
Evaluation accounts come with predefined objectives that traders must satisfy while staying within strict risk parameters. If account information is scattered across several pages, traders may spend unnecessary time checking compliance instead of focusing on execution.
A centralized dashboard reduces that friction. Quick access to equity levels, drawdown limits, and challenge progress allows traders to make decisions using current account conditions rather than estimates.
This becomes even more useful for traders managing multiple funded or evaluation accounts simultaneously, where efficient monitoring can help maintain consistency across different trading sessions.
Supporting Better Risk Management
The dashboard places noticeable emphasis on risk management rather than profit alone.
Highlighting remaining drawdown capacity alongside current profits encourages traders to consider capital preservation throughout the challenge. Even after reaching positive performance, maintaining awareness of remaining risk limits is essential because a single oversized position can invalidate an otherwise successful evaluation.
The inclusion of minimum trading day progress also helps traders pace their activity instead of attempting to complete an evaluation through unnecessary overtrading.
A Modern Interface for Active Traders
Beyond performance metrics, the layout appears structured for quick interpretation. Individual statistic panels, graphical equity tracking, and clearly separated challenge objectives reduce visual clutter while keeping frequently referenced information accessible.
For traders who regularly monitor their accounts during active market sessions, this type of organization can shorten the time required to assess account health before entering new positions.
Although trading performance ultimately depends on strategy and discipline, a well-designed interface can remove much of the administrative burden associated with monitoring funded account requirements.
Conclusion
The Bullwaves Prime dashboard demonstrates an emphasis on transparency by placing trading analytics, challenge objectives, and risk metrics within a single workspace. Rather than functioning solely as an account summary, it serves as an operational tool that helps traders monitor compliance while keeping track of performance throughout their evaluation.
As proprietary trading firms continue refining the trader experience, comprehensive dashboards are becoming an increasingly valuable part of the overall funding ecosystem, not because they change challenge rules, but because they make those rules easier to manage in real time.
If you’re considering Bullwaves Prime, read the complete Forex Prop Reviews firm review to explore its funding programs, evaluation models, trading rules, and platform features. You can also use the exclusive FPR discount code (FOREXPROPREVIEWS) available on our review page to reduce the cost of your challenge purchase.